
Summary
Wholesale used-vehicle prices strengthened in January as supply tightened, lifting the Manheim Used Vehicle Value Index (MUVVI) to its highest level in more than two years and signaling an earlier-than-usual spring bounce supported by firm retail demand and tax refund season.
January index and pricing
- MUVVI: 210.5, up 2.4% year over year (vs. January 2025) and 2.4% month over month (mix-, mileage-, and seasonally adjusted).
- Non-adjusted wholesale prices rose 2.5% year over year and 2.7% from December.
- Seasonality context: January’s long-term average move is a 0.2% decline on an adjusted basis and a 0.4% increase on a non-adjusted basis, highlighting stronger-than-normal momentum this year.
Demand and auction indicators
- Manheim Market Report prices for three-year-old vehicles increased 1.5% in January.
- MMR retention: 100.0% on average, up 20 bps year over year and 0.4 pp from December, indicating sale prices closely tracked guidebook values.
- Sales conversion: 60.7%, 3.2 pp above the recent three-year January average and 6.5 pp higher than December, signaling strengthening demand.
Segment performance
- Most segments were modestly higher year over year, with luxury continuing to outperform the broader market.
- Compact and midsize cars showed comparatively weaker price growth versus January 2025.
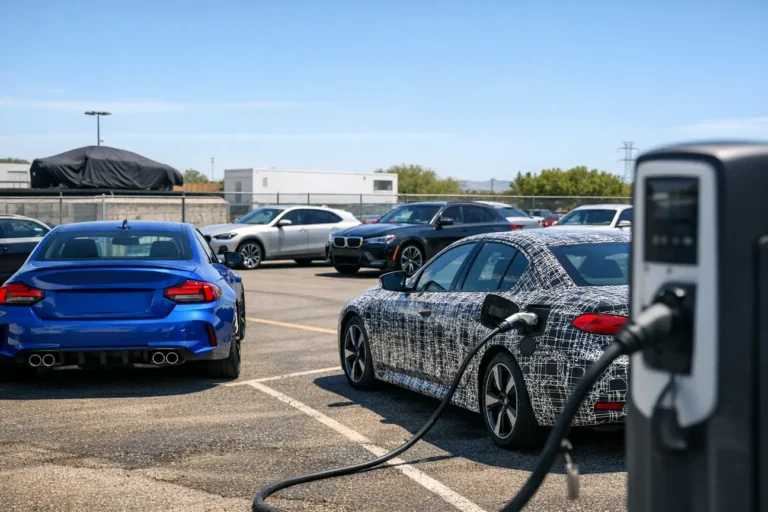
EV vs. non-EV pricing
- EV Index: +0.8% year over year; +0.4% month over month.
- Non-EV Index: +2.2% year over year; +2.2% month over month.
- Expiration of government-backed EV incentives tempered EV price gains; even so, EV values were slightly higher than a year ago following steeper depreciation in early last year.
Supply conditions
- Wholesale days’ supply: 26.6 at January-end, down 0.3 days year over year and 5.1 days from December.
- Pre-pandemic benchmark: ~32 days at the end of January; current levels sit below historical norms, reinforcing price support.
Rental segment
- Seasonally adjusted: prices +2.4% year over year; -0.3% month over month.
- Non-adjusted: prices +2.7% year over year; +0.6% month over month.
- Average mileage fell 19% from last January, contributing to stronger non-adjusted values.
Market drivers and outlook
- Stronger retail demand and the start of tax refund season (with expectations for more and larger refunds) supported wholesale values.
- Market interest rates showed a muted response despite three Fed cuts since September.
- Tight used-vehicle supply suggests the early spring bounce could persist longer than usual.
Methodology and schedule
- MUVVI tracks wholesale used-vehicle values independent of vehicle mix and mileage.
- The index was rebased in 2023 to set January 1997 = 100; monthly and yearly percent changes since 2015 were unchanged.
- Manheim publishes MUVVI on the fifth business day each month; any mid-month figures are checkpoint readings, not official estimates or flash indicators.
- Next full MUVVI release: Friday, March 6; Q1 MUVVI call: Tuesday, April 7 at 11 a.m. ET.